packages = ["numpy", "matplotlib", "graphviz", "pandas", "simpy"]
def print(input):
display(input)
model_diagram_svg = """
3.6183950911608798: Car 1 entered from incoming_cars
3.6183950911608798: Car 1 incoming_cars -> charger
3.6183950911608798: Car 1 requesting charger resource
3.6183950911608798: Car 1 granted charger resource waiting time 0.0
10.705255755796346: Car 1 completed using charger resource with service time 7.086860664635466
10.705255755796346: Car 1 charger -> payment
11.415286221992927: Car 2 entered from incoming_cars
...
"""
# Import and use JS functions and variables in Python
from js import default_graph, display_model_svg, console
from js import document
from pyodide.ffi import create_proxy
count = 0
def button_click(event):
global count
count += 1
dot_from_output(new_graph)
#document.getElementById("msg").innerHTML = 'Button Clicked ' + str(count)
#document.getElementById("test").innerHTML = 'new graph coming'
def render_string(event):
svg_from_dot("digraph G {Hello->World}")
document.getElementById("msg").innerHTML = 'render from string'
#document.getElementById("test").innerHTML = 'new graph coming'
def setup():
# The page is ready, clear the "page loading"
document.getElementById("car").innerHTML = model_diagram_svg
# Create a JsProxy for the callback function
click_proxy = create_proxy(button_click)
click_proxy2 = create_proxy(render_string)
# Set the listener to the callback
e = document.getElementById("Render")
e.addEventListener("click", click_proxy)
f = document.getElementById("Render_string")
f.addEventListener("click", click_proxy2)
def draw_model_diagram():
draw_model()
display(HTML(display_model_svg(str(graph), 'dot')))
setup()
#console.log("Hello " + default_graph)
#dot5(default_graph)
"""
PyML Version .20
Copyright (c) 2022 Ray Madachy
Permission is hereby granted, free of charge, to any person obtaining a copy of this software and associated documentation files (the "Software"), to deal in the Software without restriction, including without limitation the rights to use, copy, modify, merge, publish, distribute, sublicense, and/or sell copies of the Software, and to permit persons to whom the Software is furnished to do so, subject to the following conditions:
The above copyright notice and this permission notice shall be included in all copies or substantial portions of the Software.
THE SOFTWARE IS PROVIDED "AS IS", WITHOUT WARRANTY OF ANY KIND, EXPRESS OR IMPLIED, INCLUDING BUT NOT LIMITED TO THE WARRANTIES OF MERCHANTABILITY, FITNESS FOR A PARTICULAR PURPOSE AND NONINFRINGEMENT. IN NO EVENT SHALL THE AUTHORS OR COPYRIGHT HOLDERS BE LIABLE FOR ANY CLAIM, DAMAGES OR OTHER LIABILITY, WHETHER IN AN ACTION OF CONTRACT, TORT OR OTHERWISE, ARISING FROM, OUT OF OR IN CONNECTION WITH THE SOFTWARE OR THE USE OR OTHER DEALINGS IN THE SOFTWARE.
"""
import csv
import itertools
import graphviz
import textwrap
import os
import sys
from os.path import exists
import pandas as pd
from copy import deepcopy
online = True
# Discrete Event Modeling
import simpy
import graphviz
import random
import numpy as np
import matplotlib.pyplot as plt
import matplotlib as mpl
mpl.rcParams['axes.spines.top'] = False
mpl.rcParams['axes.spines.right'] = False
def run_model(verbose=True):
"""
Executes the current model
Returns
----------
If continuous, returns 1) Pandas dataframe containing run outputs for each variable each timestep and 2) model dictionary.
If discrete, returns 1) network dictionary with run statistics and 2) entity run data
"""
verbose = verbose
if (model_type == "continuous"): return(run_sd_model())
if (model_type == "discrete"): return(run_de_model(verbose))
# Discrete Event Modeling
# define network dictionary of dictionaries
network = {}
run_specs = {}
entity_num = 0
entity_data = {}
verbose = True
def init_de_model():
"""
Instantiates a discrete event model for simulation
"""
global env, entity_num, entity_data, run_specs, model_type
network.clear()
run_specs.clear()
entity_num = 0
entity_data.clear()
# create simulation environment
env = simpy.Environment()
model_type = "discrete"
def add_server(name, connections, service_time, capacity=1):
network[name] = {
'type': 'server',
'resource': simpy.Resource(env, capacity=capacity),
'connections': connections,
'service_time': service_time,
'waiting_times': [],
'service_times': []
}
def add_delay(name, connections, delay_time):
network[name] = {
'type': 'delay',
'connections': connections,
'delay_time': delay_time,
}
def add_source(name, entity_name, num_entities, connections, interarrival_time):
"""
Add a source node to a discrete event model to generate entities.
Parameters
----------
name: string
A name for the source.
connections: dictionary
A dictionary of the node connections after the source. The node names are the keys and the values are the relative probabilities of traversing the connections.
interarrival_time: the time between entity arrrivals into the system. May be a constant or random function.
The number of resource usage slots in the server
"""
network[name] = {
'type': 'source',
'entity_name': entity_name,
'num_entities': num_entities,
'connections': connections,
'interarrival_time': interarrival_time,
}
run_specs['interarrival_time'] = interarrival_time
run_specs['num_entities'] = num_entities
run_specs['entity_name'] = entity_name
run_specs['source'] = name
def add_terminate(name):
network[name] = {
'type': 'terminate',
'connections': {}}
# define processes for each entity
def process_initial_arrival(env, arrival_time, node_name, entity_num, entity_name):
yield env.timeout(arrival_time)
print(f"{env.now}: {entity_name} {entity_num} entered from {run_specs['source']}")
env.process(process_node(env, node_name, entity_num, entity_name))
# define processes for each node
def process_node(env, node_name, entity_num, entity_name):
# process resource usage
if network[node_name]['type'] == 'delay':
delay_time = eval(network[node_name]['delay_time'])
yield env.timeout(delay_time)
print(f"{env.now}: {entity_name} {entity_num} delayed {delay_time} at {node_name}")
entity_data[entity_num]['nodes'].append((node_name, env.now))
if network[node_name]['type'] == 'server':
with network[node_name]['resource'].request() as req:
print(f"{env.now}: {entity_name} {entity_num} requesting {node_name} resource ")
this_arrival_time = env.now
#entity_data[entity_num]['nodes'].append((node_name, env.now))
yield req
waiting_time = env.now - this_arrival_time
# collect waiting times
network[node_name]['waiting_times'].append(waiting_time)
print(f"{env.now}: {entity_name} {entity_num} granted {node_name} resource waiting time {waiting_time}")
service_time = eval(network[node_name]['service_time'])
yield env.timeout(service_time)
# collect service times
network[node_name]['service_times'].append(service_time)
entity_data[entity_num]['nodes'].append((node_name, env.now))
print(f"{env.now}: {entity_name} {entity_num} completed using {node_name} resource with service time {service_time}")
if network[node_name]['type'] == 'terminate':
print(f"{env.now}: {entity_name} {entity_num} leaving system at {node_name} ")
entity_data[entity_num]['nodes'].append((node_name, env.now))
# process arrivals and connections
if len(network[node_name]['connections']) > 0:
weights = tuple(network[node_name]['connections'].values())
#print(weights)
connection, probability = random.choice(list(network[node_name]['connections'].items()))
connection = random.choices(list(network[node_name]['connections'].keys()), weights, k=1)[0]
print(f"{env.now}: {entity_name} {entity_num} {node_name} -> {connection}")
env.process(process_node(env, connection, entity_num, entity_name))
arrival_time =0
entity_num = 0
entity_data = {}
def run_de_model(verbose=True):
"""
Executes the current model
Returns:
----------
Simulation output
"""
#global verbose
verbose = verbose
for key, value in network.items():
if value.get('type') == 'source':
source_name = key
arrival_time = 0
for entity_num in range(run_specs['num_entities']):
#yield env.timeout(1)
arrival_time += eval(run_specs['interarrival_time'])
entity_num += 1
entity_data[entity_num] = {'arrival': arrival_time, 'nodes': []}
env.process(
process_initial_arrival(env, arrival_time, source_name,
entity_num, run_specs['entity_name'])) #+str(entity)
# start simulation at first node
#env.process(process_node(env, 'node1'))
env.run()
return network, entity_data
def draw_model():
global graph
for key, value in network.items():
if value.get('type') == 'source':
source_name = key
# create graphviz graph
graph = graphviz.Digraph()
graph.attr(rankdir='LR', ranksep='.7')
for node_name in network:
if network[node_name]['type'] == "source": graph.node(node_name, label=f'❚❚❱\n\{node_name}', shape='none')
if network[node_name]['type'] == "terminate": graph.node(node_name, label=f'❱❚❚\n\{node_name}', shape='none')
if network[node_name]['type'] == "server": graph.node(node_name, label=f'❚❚▣\n{node_name}', shape='none')
if network[node_name]['type'] == "delay": graph.node(node_name, label=f'🕑\n{node_name}', shape='none')
for connection in network[node_name]['connections']:
graph.edge(node_name, connection,)
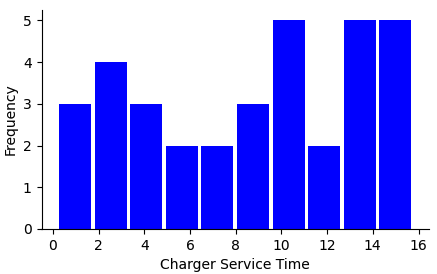
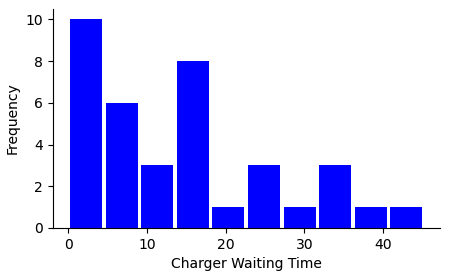
def plot_histogram(data, xlabel= "Data"):
kwargs = {'color': 'blue', 'rwidth': 0.9}
fig, ax = plt.subplots(figsize=(5, 3))
ax.hist(data, **kwargs)
ax.set(xlabel=xlabel, ylabel='Frequency')
ax.xaxis.labelmargin = -50
ax.yaxis.labelmargin = 30
plt.subplots_adjust(bottom=0.15,)
return fig
Discrete Event Modeling Demonstrations with se-lib
Enter se-lib function calls and other Python statements in code cells and click the green run button or hit shift-enter to run the scripts. Additional models and other scripts can be created in the blank code cells at the end that are automatically generated after runs. The following functions are available:
Add a source node to a discrete event model to generate entities.
Parameters:
name (string) – A name for the the source.
connections (dictionary) – A dictionary of the node connections after the source. The node names are the keys and the values are the relative probabilities of traversing the connections.
num_entities (integer) – Number of entities to be generated.
interarrival_time (float) – The time between entity arrrivals into the system. May be a constant or random function.
connections (dictionary) – A dictionary of the node connections after the server. The node names are the keys and the values are the relative probabilities of traversing the connection.
capacity (integer) – The number of resource usage slots in the server
connections (dictionary) – A dictionary of the node connections after the delay. The node names are the keys and the values are the relative probabilities of traversing the connections.
delay_time (float) – The time delay for entities to traverse. May be a constant or random function.
Draw a diagram of the current model. File saving is not available in this online mode.
Returns:
Rendered result in default viewing application. se-lib calls the Graphviz API for this.
Return type:
graph object view
The connections parameter is a dictionary with the paths as keys for the probabilities of traversing the paths. The following illustrates a 70% probability of hit targets:
A source node for entities is required for a discrete event simulation.
The model data is available in the network dictionary for the model structure and statistics, and the run_specs dictionary for simulation control parameters.
These could be accessed as follows after a simulation run:
 """
# Import and use JS functions and variables in Python
from js import default_graph, display_model_svg, console
from js import document
from pyodide.ffi import create_proxy
count = 0
def button_click(event):
global count
count += 1
dot_from_output(new_graph)
#document.getElementById("msg").innerHTML = 'Button Clicked ' + str(count)
#document.getElementById("test").innerHTML = 'new graph coming'
def render_string(event):
svg_from_dot("digraph G {Hello->World}")
document.getElementById("msg").innerHTML = 'render from string'
#document.getElementById("test").innerHTML = 'new graph coming'
def setup():
# The page is ready, clear the "page loading"
document.getElementById("car").innerHTML = model_diagram_svg
# Create a JsProxy for the callback function
click_proxy = create_proxy(button_click)
click_proxy2 = create_proxy(render_string)
# Set the listener to the callback
e = document.getElementById("Render")
e.addEventListener("click", click_proxy)
f = document.getElementById("Render_string")
f.addEventListener("click", click_proxy2)
def draw_model_diagram():
draw_model()
display(HTML(display_model_svg(str(graph), 'dot')))
setup()
#console.log("Hello " + default_graph)
#dot5(default_graph)
"""
# Import and use JS functions and variables in Python
from js import default_graph, display_model_svg, console
from js import document
from pyodide.ffi import create_proxy
count = 0
def button_click(event):
global count
count += 1
dot_from_output(new_graph)
#document.getElementById("msg").innerHTML = 'Button Clicked ' + str(count)
#document.getElementById("test").innerHTML = 'new graph coming'
def render_string(event):
svg_from_dot("digraph G {Hello->World}")
document.getElementById("msg").innerHTML = 'render from string'
#document.getElementById("test").innerHTML = 'new graph coming'
def setup():
# The page is ready, clear the "page loading"
document.getElementById("car").innerHTML = model_diagram_svg
# Create a JsProxy for the callback function
click_proxy = create_proxy(button_click)
click_proxy2 = create_proxy(render_string)
# Set the listener to the callback
e = document.getElementById("Render")
e.addEventListener("click", click_proxy)
f = document.getElementById("Render_string")
f.addEventListener("click", click_proxy2)
def draw_model_diagram():
draw_model()
display(HTML(display_model_svg(str(graph), 'dot')))
setup()
#console.log("Hello " + default_graph)
#dot5(default_graph)